
A Changeable Winter Month
Welcome to the monthly overview of December 2024 for MeteoTielt - Weather Station Tielt.
December 2024 brought us a true mix of winter scenes and wet days. Although the month was predominantly mild, we were also treated to cold nights and strong gusts of wind. MeteoTielt - Weather Station Tielt looks back on a changeable month in which the sun only appeared sporadically.
Temperature:
A Dynamic Start
The month began with moderate temperatures averaging between 6°C and 10°C during the day, while the nights were cool but still above freezing. However, on 6 December, we saw a first clear drop, with temperatures falling below 0°C for the first time.
Mid-Month: Peaks and Troughs
The middle of the month was characterised by notable temperature peaks, with some days where the maximum temperature rose to as much as 14°C. This was unusually warm for December and gave a brief autumnal feel. However, there were also cold moments, with night temperatures occasionally dipping below freezing again.
A Changeable End
The last week of December brought another mix of cold and milder periods. Especially around 27 December, the minimum temperature dropped significantly, with values sinking deep below 0°C. During the day, temperatures remained milder, but the clear presence of winter cold was unmistakable.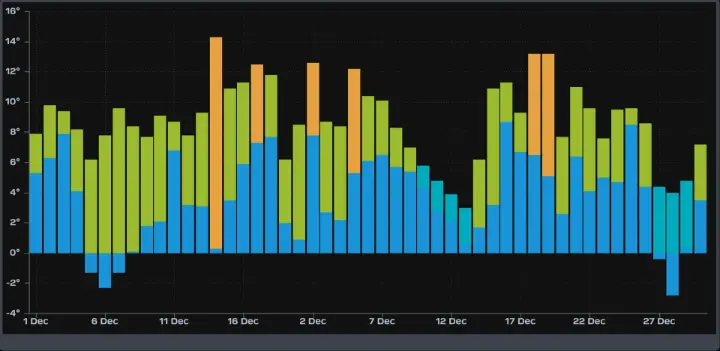
Precipitation:
Precipitation varied greatly throughout the month. Particularly the first week of December brought significant rainfall with a peak around 2 December and a noticeable increase on 7 December. These days recorded the highest precipitation amounts, with a maximum that seems to reach nearly 30 mm on 7 December.
The rest of the month was significantly calmer in terms of precipitation, although some rain did fall on a few days. On 22 December, another notable precipitation event was recorded, but with a clearly lower intensity than earlier in the month.
Dry and wet periods
Between 11 and 17 December and after 24 December, there were mainly dry days or days with minimal precipitation (<1 mm). For example, only 0.8 mm of rain was measured on 24 December. This provided a relatively calm end to the month.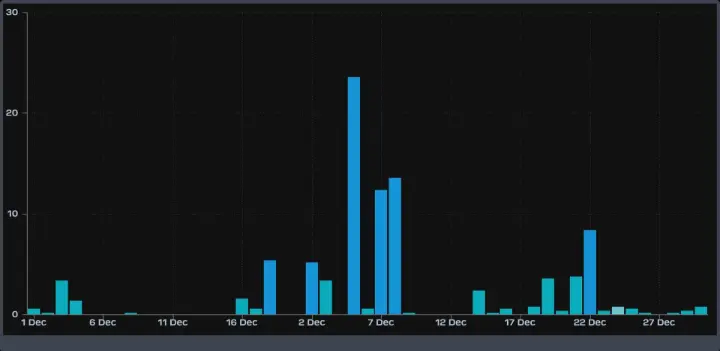
Wind:
The graph shows that wind speeds in December varied from relatively calm days to periods with intense wind peaks. Some key observations:
- Busiest wind days: Particularly around 7 December, 16 December, and 22 December, peak values were recorded that reached nearly 60 km/h. These days were characterised by strong gusts of wind.
- Calmer periods: Around 12 December and after 25 December, wind speeds were noticeably lower, with a clear return to calmer conditions.
Distribution: Wind speeds were categorised, visible in the colour gradations in the graph: green (low wind speed), yellow (moderate), orange (high), and red (very high).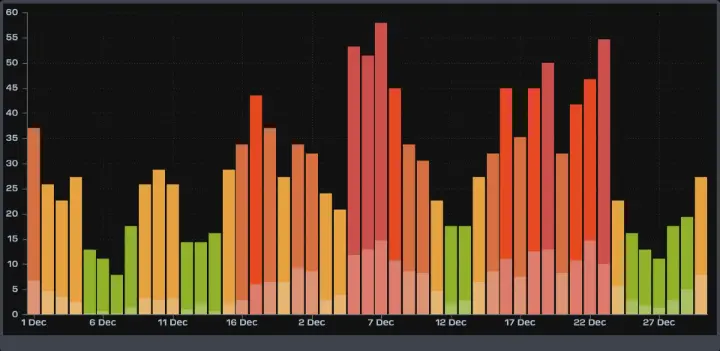
Wind directions
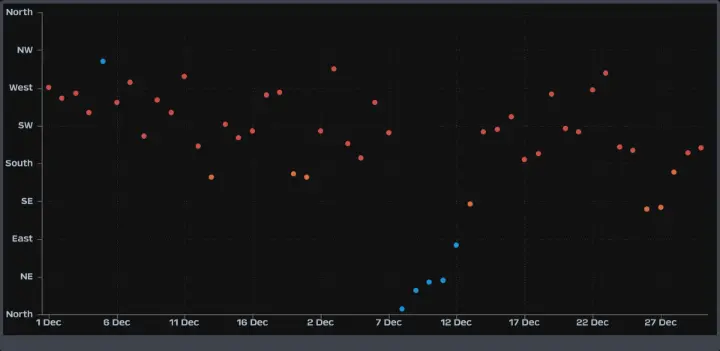
This graph provides insight into the directions from which the wind predominantly blew:
- Dominant directions: The west and southwest were the most common wind directions in December, which is typical for the winter season and indicates a westerly circulation.
- Notable moments: There were some deviations in the wind direction, such as the northwesterly wind on 12 December and a southeasterly wind for several days later in the month.
- Variation: Overall, the wind direction remained stable with a slight spread to other wind areas, mainly during calm periods.
Sunshine:
The graph shows that solar radiation in December varied significantly. At the beginning and middle of the month, there were some peaks, with a notable spike around 4 December, where solar radiation peaked above 400 W/m². This was due to a clear day.
The remaining days of the month showed predominantly lower levels of solar radiation, with some sporadic clearings. The overall picture indicates a typical winter month with limited solar radiation, as expected for December.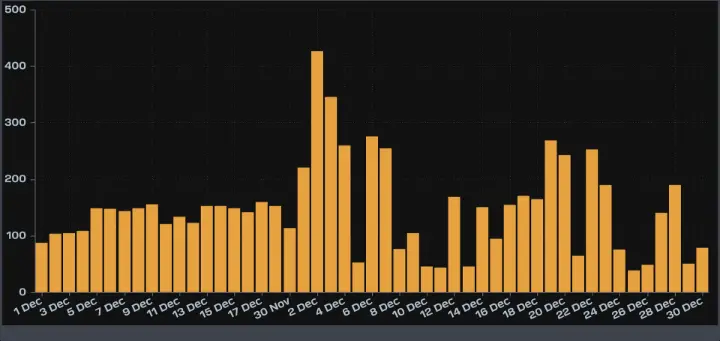
UV index:
The UV index remained very low throughout the month, as is usual in the winter period. Most days recorded hardly any UV activity, with a maximum of 1 to 2 on a few clear days around 10 and 16 December. This indicates a minimal risk of harmful UV radiation, which is typical for the short days and low sun position in December.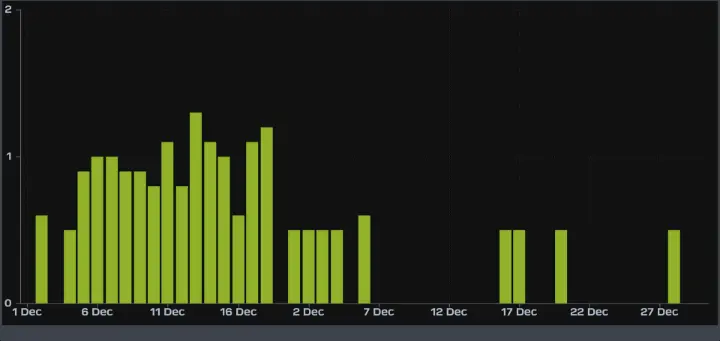
Air quality:
The month of December brought a notable variation in air quality in Tielt. Based on measurements, we can determine how levels of air pollution fluctuate, with specific peaks and troughs reflecting what we could experience daily.
Week 1: Early December
The month began with moderate air quality values. Around 2 December, the values were relatively high, with the peak just above 100. This indicates an increased concentration of fine particulate matter, possibly caused by cold temperatures and the use of wood stoves. However, there were also moments of better air quality, mainly in the morning hours.
Week 2: Towards the middle of the month
In the week of 7 December, we saw a clear improvement in air quality. The values noticeably decreased, especially during the first half of the week, with a low peak around 40. However, around 12 December, there was a very strong increase to values above 120, indicating a severe pollution peak. Possible causes for this could be a combination of a lack of wind and increased emissions from traffic and heating.
Week 3: Stabilisation
After the pollution peak, a period of stabilisation followed. Around 17 December, the levels were again around 80 to 100, which falls within the range of moderate air quality. This period shows how weather conditions and human activities can balance to create a relatively stable, albeit not ideal, level of air quality.
Week 4: Last week of December
The last week of the month, around 27 December, brought another increase in air pollution, with a peak around 120. Despite the holidays, there were again moments of significantly worse air quality, which can be attributed to increased emissions from festive activities and extra traffic.
The month of December showed how air quality fluctuates significantly in Tielt. From a few days with relatively good values to moments of heavy pollution, this overview demonstrates that it remains important to be conscious of energy consumption and emissions. Small changes, such as burning less wood and limiting car use, can contribute to cleaner air and a healthier living environment.
Let us continue to work together for better air quality!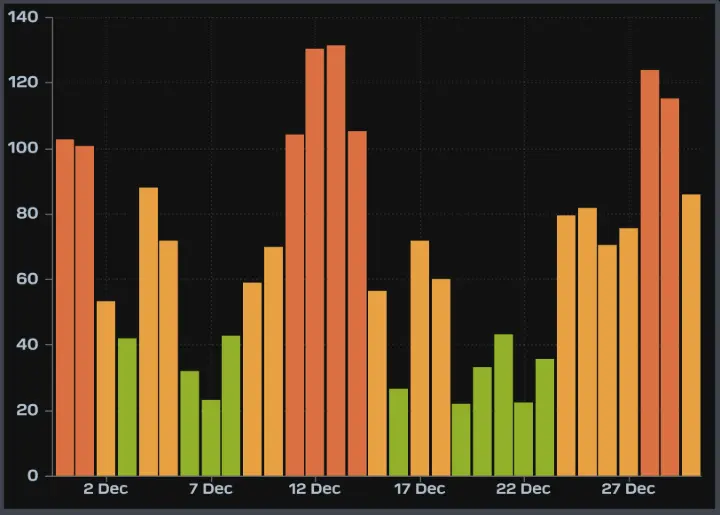
Conclusion:
- A month with contrasting days, where mild autumn days and cold winter days quickly alternated.
December in Tielt has once again shown how unpredictable the weather can be during this transitional period. It was a month of extremes, both in terms of warmth and cold, which made it interesting for weather enthusiasts!